


Executive Dashboards: The First Step to Successful Business Intelligence
Originally published January 29, 2025. Updated September 3, 2026.
Organizations that treat meetings and events data as a strategic asset gain greater financial visibility, stronger governance, improved stakeholder alignment, and faster decision-making.
Intent Strategy Group, M&IW’s consulting division for Strategic Meetings Management (SMM) and related technology initiatives, recommends a clear solution for turning your business intelligence (BI) data into actionable insights: executive dashboards.
In this blog post, ISG’s Angie Duncan Callaway, CMM, Sr. Director, and Laura Rog, Lead Business Intelligence Consultant, share their expertise to help you make the most of your meetings and events (M&E) data. You’ll learn how executive dashboards help you understand M&E program performance, mitigate risk, optimize spend, and make informed strategic decisions. Plus, discover a real-world success story from an ISG customer.
Business Intelligence and Executive Dashboards
Business intelligence goes a step beyond data analysis by developing strategic plans for informed decision making across your meetings and events (M&E) program.
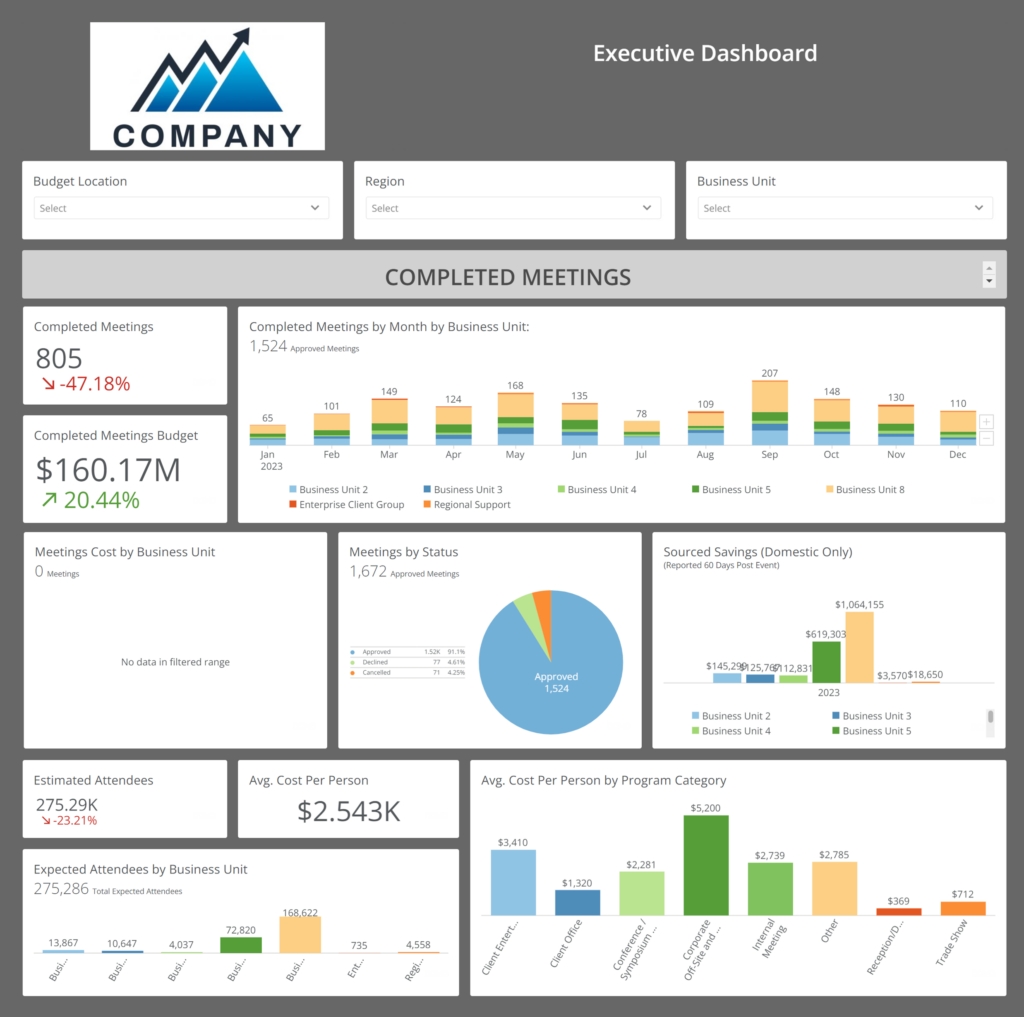
“BI uses technology and other tools to collect and analyze data from an M&E program and turn it into actionable insights,” said Laura. “Executive dashboards are the visual representation of the data collected in one central location. But more than that, they turn individual pieces of data into a program-wide intelligence framework to support decision making and serve as a single source of truth.”
While a dashboard containing all available data would quickly become overwhelming, executive dashboards are designed to highlight the high-level metrics and insights that matter most to leaders, making each one unique to an organization’s priorities. Ultimately, the goal is to provide a clear view of the program’s overall health, trends, and performance across regions and departments.
“Visual executive dashboards offer a powerful tool for driving performance improvements and steering you toward your objectives surrounding events,” said Angie. “They support everything from financial oversight and supplier management to operational governance and strategic planning.”
Six Benefits of Executive Dashboards
Executive dashboards powered by business intelligence provide six key benefits: data visualization, time savings, real-time intelligence, improved decision-making, customization, and opportunity and risk identification.
1. Data Visualization
Visual dashboards present complex data in an easily understandable and visually appealing format. You and your stakeholders can quickly access key insights without delving into overwhelming reports or spreadsheets.
“Having visibility into event volume, spend, and cost savings data keeps leaders up to date on fast-moving and ever-growing events environments,” said Angie.
2. Efficiency and Time Savings
Automating data compilation and analysis from various sources enhances accuracy and reliability, freeing up valuable time for your teams to prioritize major events, engage stakeholders, and focus on high-priority projects. Transitioning static reports into dynamic data repositories also expedites report delivery without manual intervention. This streamlined reporting enables effortless completion of administrative tasks in less time, leading to cost savings from event agencies.
3. Real-Time Intelligence
Dashboards offer 24/7 access to real-time data for prompt decision-making and proactive responses to registration data, emerging trends, or challenges.
“Your stakeholders want to know what’s happening now,” said Laura. “Dashboards make it possible to access the data they need when they need it.”
4. Improved Decision-Making
By providing a clear overview of relevant data, dashboards empower you to make data-driven decisions with confidence. You can easily identify patterns, trends, and correlations that lead to more informed, effective, and strategic choices.
“It’s not just at the event level, either,” said Angie. “Dashboards allow you to see the big picture so you can make better decisions for your overall M&E program.”
5. Customization and Personalization
Visual dashboards are tailored to meet your specific meeting and event needs, varying by stakeholders and departments. Dashboards are evergreen and continue to evolve as your organization grows and strategic directions change.
6. Opportunity and Risk Identification
Visual dashboards highlight both opportunities for growth and potential risks or challenges. By monitoring key performance indicators in real time, you can proactively capitalize on opportunities or identify emerging risks before they affect business performance.
Case Study: Integrating Executive Dashboards with Business Intelligence Solutions
By combining standardized data governance practices with executive dashboards and a modern BI solution, ISG helped a global company gain unprecedented visibility into program performance, strengthen oversight, and improve financial accountability across its meetings ecosystem.
“Our customer’s legacy SMM platform was being phased out, so they used this opportunity to not only upgrade their platform but also optimize their use of it,” said Angie. “Specifically, they were looking to integrate a new BI solution to achieve dynamic enterprise analytics on their event activity and spend.”
After centralizing and standardizing the customer’s data entry process in the new technology platform, ISG consolidated the global governance data monitoring process using executive dashboards, resulting in enhanced oversight and improved performance.
Oversight Outcomes
- Documented and tracked M&E spend saw a 200% increase in only ten months.
- Line of sight on events increased by 75% in the fiscal year.
- Savings tracked improved by 20% against contracted liabilities.
Performance Outcomes
- RFPs awarded increased by more than 50% at a 99.6% award rate.
- The number of event websites launched increased 23% over the previous year.
- Attendee registration increased 58% over the previous year.
ISG Customer Kudos
After the project was complete and the results already speaking for themselves, the customer had nothing but praise for ISG and their business intelligence capabilities.
“Thank you for enthusiastically taking on this mind-boggling project and for your incredible mind for detail and process,” said the customer’s director of event services. “The data governance piece of our partnership is invaluable. Simply terrific work.”
Investing in Intent Strategy Group
ISG helps organizations establish the governance, processes, technology strategy, and intelligence frameworks required to transform meetings data into measurable value. Customers who leverage ISG’s services expedite implementations, reduce project durations, and fast-track early wins.
Contact ISG to learn more or start transforming your M&E program into a strategic business asset.
Learn from ISG’s Consultants
Intent Strategy Group’s consultants recently hosted a LinkedIn Live event, “Creating Data-Driven Roadmaps for High-Impact Meetings and Events,” where they discussed how to connect strategic roadmaps with a deliberate data strategy that aligns meetings programs with business goals and create measurable outcomes.
Watch the on-demand recording to discover how to elevate your meetings program to be a strategic business driver at the executive level.
Meet the Experts

Angie Duncan Callaway, CMM
Sr. Director
Intent Strategy Group

Laura Rog
Lead Business Intelligence Consultant
Intent Strategy Group
Related Articles
- Registration Now Open: Creating Data-Driven Roadmaps for High-Impact Meetings and Events
- Project Management for Meetings and Events: How PMP®-Certified Professionals Benefit Your Strategic Meetings Management Program
- From Process to Strategy: Harnessing the Power of Data in Strategic Meetings Management Programs (SMMP)
- Building Resilient and Scalable Strategic Meetings Management Programs
To stay up to date on the latest trends and insights in corporate meetings, events, and incentives, follow us on LinkedIn.